It also works well for real-world data — time, distance, price — where values are never negative.
What people use it for
- Introducing ordered pairs (x, y)
- Line graphs of measurements over time
- Coordinate grid mystery pictures
- Proportional relationships and rate tables
How to print it
- Choose the paper type, grid size and paper size above. The preview updates as you go.
- Click Download PDF (or Print to open it straight away).
- In the print dialog, set the scale to 100% or Actual size so the grid measures exactly what you selected.
More free templates
 Free Printable Graph Paper
 Printable Grid Paper
 1/4 Inch Graph Paper (Quad Paper)
 5mm Graph Paper
 1 cm Graph Paper (Centimeter Grid)
 1 Inch Graph Paper
 Engineering Paper
 Dot Grid Paper
 Isometric Graph Paper
 Isometric Dot Paper
 Hexagonal Graph Paper
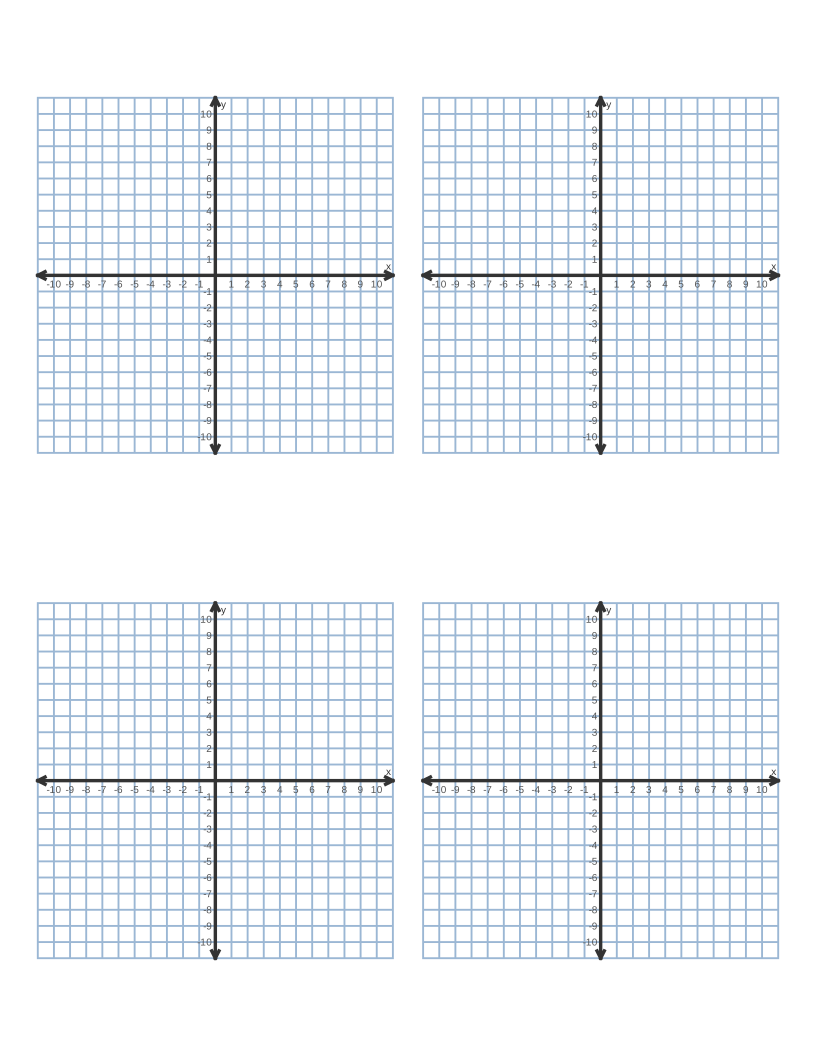 Coordinate Plane Graph Paper
 Polar Graph Paper
 Printable Lined Paper
 A4 Graph Paper
 1/8 Inch Graph Paper
 1/2 Inch Graph Paper
 Millimeter Graph Paper
 2 mm Graph Paper
 10 Squares per Inch Graph Paper
 11 × 17 Graph Paper
 A3 Graph Paper
 Legal Size Graph Paper
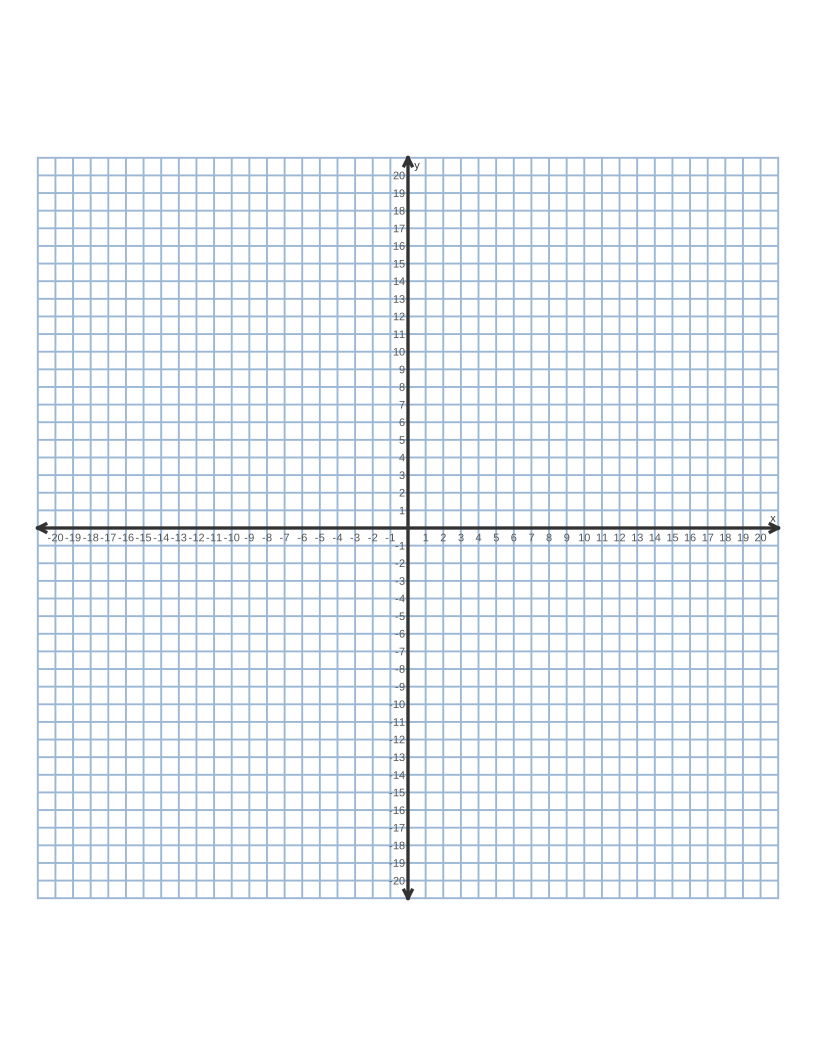 Graph Paper with Numbers
 Printable Handwriting Paper
 Primary Writing Paper with Picture Box
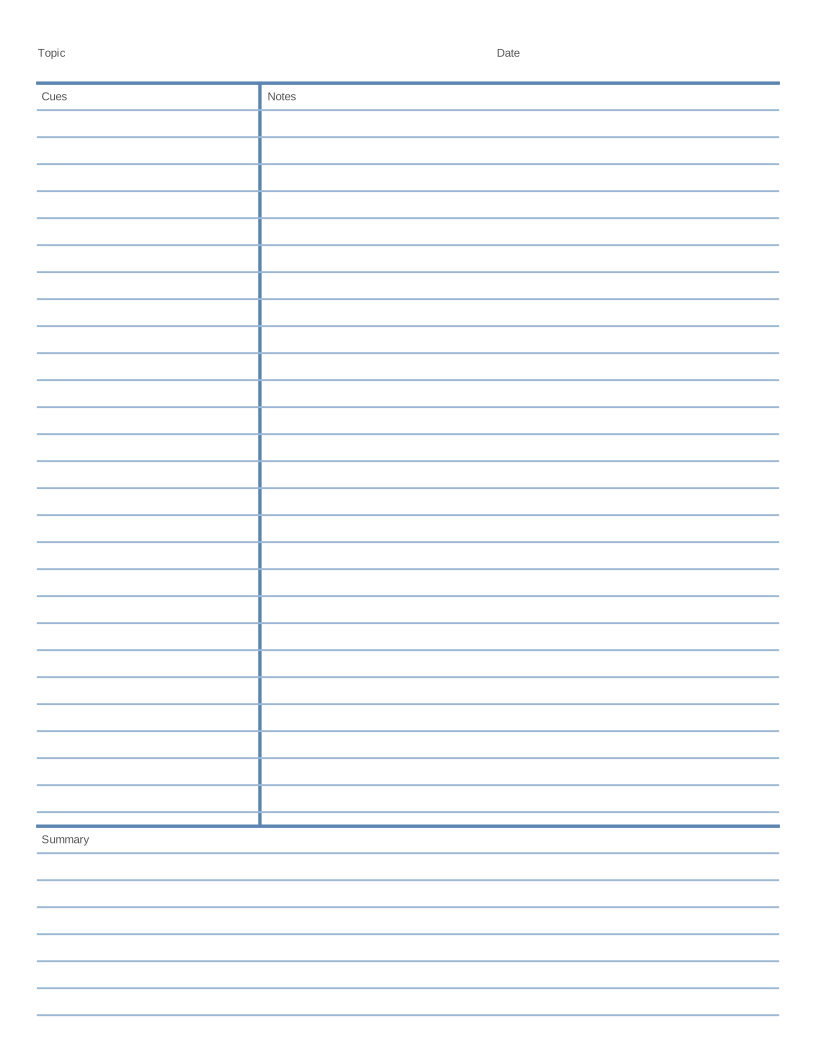 Cornell Notes Template
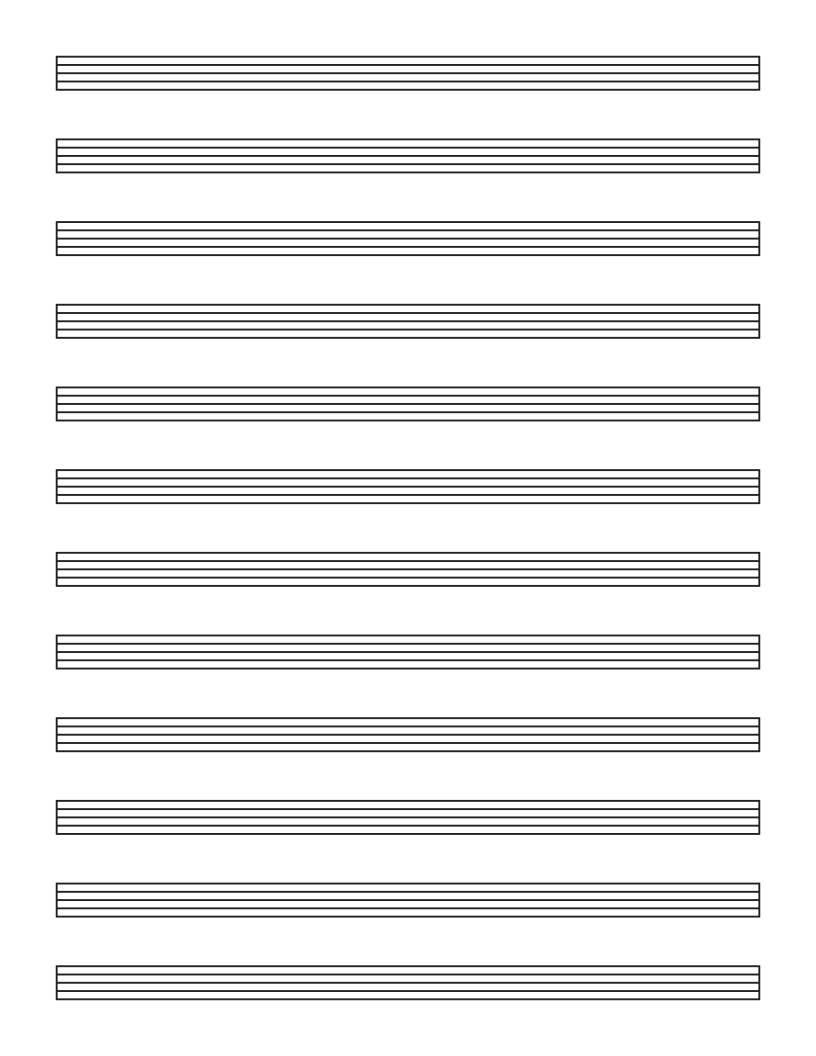 Blank Sheet Music (Music Staff Paper)
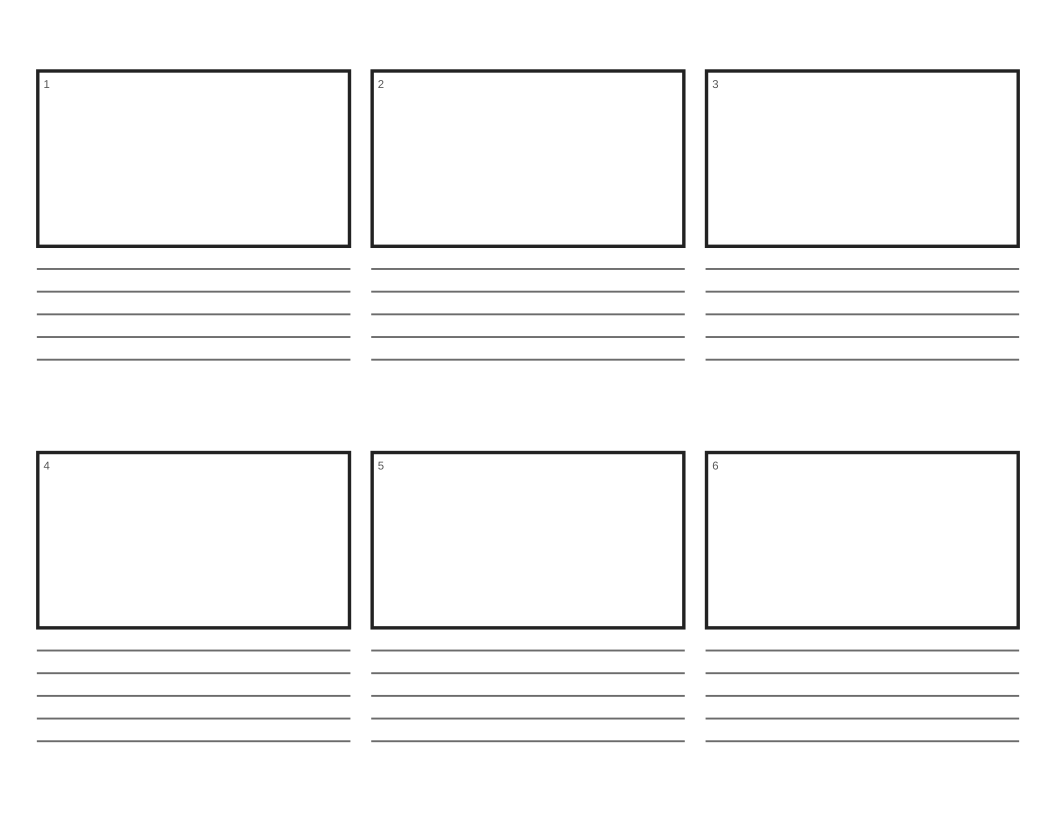 Printable Storyboard Template
Frequently asked questions
What is the first quadrant on a graph?
It is the top-right part of the coordinate plane, where both x and y are positive. Points like (3, 5) are in the first quadrant.
Can I fit four first-quadrant grids on one page?
Yes. Set "Grids per page" to 4 and "Axis range" to 10.